Seth’s Week 5 Daily Fantasy Analysis and FanDuel Lineup
October 9, 2015 – by Seth Trachtman
After a disappointing Week 3, I entered more low risk 50/50 and double up contests in Week 4 with my TRFC lineup. In total, I entered the TRFC contest (a double up), two 50/50s, one additional double up, and one tournament.
Judging by the 50/50 results, I finished somewhere around the 45th percentile. Not horrible, but certainly not good enough, as it was a full loss of entry fees this past week.
After four weeks, I’m now up $152 on $206 in contest entry fees so far, and have pocketed 5 finals tickets that could win me more cash later in the season.
| Week | Contests Entered | Entry Fees | Prize Winnings | Net Gain/Loss | Finals Tickets Won |
|---|---|---|---|---|---|
| 1 | 5 | $32 | $327 | $295 | 4 |
| 2 | 9 | $82 | $0 | ($82) | 0 |
| 3 | 5 | $45 | $29 | ($16) | 1 |
| 4 | 5 | $45 | $0 | ($45) | 0 |
| Total | 24 | $206 | $356 | $152 | 5 |
Pick Popularity: How Good is the Crowd at Picking in FanDuel?
Last week I reviewed the position-by-position correlation between ownership percentages and FanDuel fantasy points scored in 2014. The takeaway was that in general, FanDuel users appear best at picking running backs and wide receivers, but the correlation across the board wasn’t particularly strong.
However, I decided to go one step further in this player ownership percentage analysis, especially on the heels of this week’s news explosion regarding leaked player ownership percentages.
Whether there’s an advantage to having early information on player ownership is a debate for another time. What I’m trying to investigate here is simply this: Do the players with the highest ownership percentages also score the most points?
To accomplish this goal, I analyzed ownership percentiles week-by-week for all 17 weeks of the 2014 regular season. I compared these ownership percentiles both to “FanDuel points scored” percentiles, and to “FanDuel points scored per $1000 spent on salary” percentiles.
Before I get to the data, it’s important to note that these ownership percentages encompass all FanDuel entries, across all types of contests, but it’s likely the case that:
The maximum ownership percentages for certain players was actually higher in 50/50, head-to-head, and double up contests, where a conservative strategy is optimalThe maximum ownership percentages for other types of players was higher in bigger tournaments, when more of a boom-or-bust strategy is optimal
The results are in the tables below. Key:
Popularity Percentile represents the relative measure of how popular a given player was in a given week’s FanDuel lineups, compared to all other players at his position. So a popularity percentile of 100 does NOT mean that the player was in 100% of lineups; it means that the player was the most popular player picked at his position that week.Points Percentile represents the relative measure of where the player ended up in terms of points scored that week. So a points percentile of 50.0 means the player scored exactly in the middle of the pack for his position that week.Points/$ Percentile adds an element of value to Points Percentile. It’s the relative measure of how many points the player scored that week, per $1,000 of FanDuel salary that he cost, compared to his position peers.
QB Ownership Percentiles & Performance
| Popularity Percentile | Points Percentile | Points/$ Percentile |
|---|---|---|
| 100 | 65.32 | 54.57 |
| 90-99 | 60.58 | 53.12 |
| 80-89 | 61.88 | 57.09 |
| 70-79 | 57.83 | 51.99 |
| 60-69 | 60.06 | 54.91 |
| 50-59 | 51.99 | 55.42 |
| 40-49 | 60.27 | 63.35 |
| 30-39 | 46.38 | 50.12 |
| 20-29 | 47.57 | 51.46 |
| 10-19 | 47.88 | 55.27 |
| 1-9 | 15.15 | 19.33 |
| 0 | 11.23 | 14.72 |
RB Ownership Percentiles & Performance
| Entries Percentile | Points Percentile | Points/$ Percentile |
|---|---|---|
| 100 | 84.09 | 68.49 |
| 90-99 | 80.41 | 75.31 |
| 80-89 | 76.23 | 72.26 |
| 70-79 | 62.54 | 59.66 |
| 60-69 | 58.22 | 57.98 |
| 50-59 | 50.02 | 50.86 |
| 40-49 | 42.94 | 45.55 |
| 30-39 | 41.64 | 45.98 |
| 20-29 | 31.81 | 36.88 |
| 10-19 | 32.65 | 34.83 |
| 1-9 | 26.93 | 29.83 |
| 0 | 24.19 | 27.87 |
WR Ownership Percentiles & Performance
| Popularity Percentile | Points Percentile | Points/$ Percentile |
|---|---|---|
| 100 | 89.87 | 87.83 |
| 90-99 | 80.65 | 75.77 |
| 80-89 | 71.92 | 68.36 |
| 70-79 | 66.25 | 63.40 |
| 60-69 | 58.73 | 58.27 |
| 50-59 | 54.55 | 55.54 |
| 40-49 | 47.53 | 49.48 |
| 30-39 | 34.71 | 37.50 |
| 20-29 | 31.19 | 34.28 |
| 10-19 | 24.82 | 27.70 |
| 1-9 | 17.39 | 19.41 |
| 0 | 12.11 | 13.65 |
TE Ownership Percentiles & Performance
| Popularity Percentile | Points Percentile | Points/$ Percentile |
|---|---|---|
| 100 | 75.94 | 68.60 |
| 90-99 | 72.56 | 68.82 |
| 80-89 | 66.92 | 64.46 |
| 70-79 | 65.29 | 64.32 |
| 60-69 | 54.24 | 54.61 |
| 50-59 | 43.38 | 44.38 |
| 40-49 | 46.25 | 47.97 |
| 30-39 | 40.93 | 42.71 |
| 20-29 | 34.46 | 36.34 |
| 10-19 | 36.96 | 38.87 |
| 1-9 | 28.26 | 30.11 |
| 0 | 31.04 | 33.04 |
Based on this data, it looks like the crowd has limited skill in picking quarterbacks, are better at picking tight ends, and very good at picking running backs and wide receivers.
The 80th percentile of points scored last season at RB was 11.7 points. For WR, the 80th percentile was 12.3 points. Totals like these will give you a solid chance to win in 50/50 and double up contests, but certainly don’t guarantee anything. Given the usual higher roster point totals needed to win tournaments, you shouldn’t be afraid to go against the crowd and pick less popular players in those contests if you feel they’re good values.
Considering the weak correlation of defenses and kickers to points scored, I omitted those positions from the analysis.
My Week 5 Strategy
With four weeks gone by and more 2015 data to review, I’m continuing to emphasize matchups and fantasy points allowed vs. position in my lineup strategy. Still, I continue to take into account the Vegas-implied point totals.
To review my normal strategy:
Start with Vegas over/under linesEvaluate each team’s recent fantasy points allowed vs. each positionEvaluate salaries and contest format
The highest Vegas-implied point totals this week include:
| Team | Vegas Implied Points |
|---|---|
| New England (@ DAL) | 29.0 |
| Atlanta (vs. WAS) | 27.8 |
| Kansas City (vs. CHI) | 27.5 |
| Philadelphia (vs. NO) | 27.2 |
| Baltimore (vs. CLE) | 24.8 |
The lowest Vegas-implied point totals include:
| Team | Vegas Implied Points |
|---|---|
| Chicago (@ KC) | 17.5 |
| Cleveland (@ BAL) | 18.2 |
| San Francisco (@ NYG) | 18.2 |
| Oakland (vs. DEN) | 19.5 |
| Jacksonvile (@ TB) | 19.8 |
The Result: My Lineup for Week 5
Here’s my lineup for Week 5:
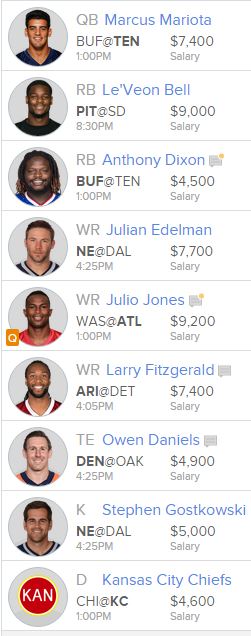
Some notes on the lineup, which includes both objective and subjective analysis:
I’m jumping back on the Marcus Mariota train, after using him in Week 3. The Titans rookie still sits sixth in points per game among available quarterbacks through three games, and while Tennessee’s Vegas-implied points total is low (20.2), Buffalo has allowed the fourth most fantasy points to quarterbacks, with more than 304 passing yards allowed per game.Le’Veon Bell could be the most popular running back this week, facing a San Diego defense that’s been terrible vs. the run. The Chargers have allowed the second most fantasy points vs. running backs, averaging more than 121 rushing yards allowed per game. Add in a run-heavy game plan with Mike Vick at quarterback, and it’s a very favorable matchup for Bell.Anthony Dixon is the risk of the lineup and a clear wild card. He’s expected to draw the start for the Bills with LeSean McCoy and Karlos Williams injured, but Dixon is also hampered by a minor calf injury. Regardless, the power back would seem to be a shoo-in for short yardage and goal line carries. At the minimum price of $4,500, one score would be enough make Dixon worthwhile.Going cheap with Dixon at running back allows me to splurge at wide receiver. New England and Atlanta sit atop the Vegas-implied point expectations, and Julian Edelman and Julio Jones are ranked in the top four in fantasy points per game among available wideouts. Larry Fitzgerald, meanwhile, is ranked No. 2 in that category and is facing a Detroit defense that’s allowing nearly 200 yards per game to wide receivers, which ranks sixth worst. All three of these wideouts are averaging at least 12 targets per game.Owen Daniels is the big opportunity to play matchups. As mentioned in previous weeks, the Oakland defense has been embarrassing vs. tight ends. They were beat again last week by Bears tight end Martellus Bennett, and still allow five more points per game to tight ends than any other defense. Daniels hasn’t been great this year, but he has touchdowns in consecutive weeks and has averaged more than five targets per game.Taking the New England kicker and Kansas City defense was a case of using Vegas-implied point totals. KC also is playing only their second home game, and have recently shown a marked advantage with their pass rush at loud Arrowhead Stadium. Last season 67% (31/46) of their sacks came at home.
That’s my lineup for Week 5. Don’t forget to compete against me in this week’s TRFC contest!
If you liked this post, please share it. Thank you! Twitter Facebook
NFL Football Pool Picks NFL Survivor Pool Picks NCAA Bracket Picks College Bowl Pool Picks College Football Pool Picks NFL Picks NBA Picks MLB Picks College Football Picks College Basketball Picks NFL Predictions NBA Predictions MLB Predictions College Football Predictions College Basketball Predictions NFL Spread Picks NBA Spread Picks MLB Spread Picks College Football Spread Picks College Basketball Spread Picks NFL Rankings NBA Rankings MLB Rankings College Football Rankings College Basketball Rankings NFL Stats NBA Stats MLB Stats College Football Stats College Basketball Stats NFL Odds NBA Odds MLB Odds College Football Odds College Basketball Odds A product ofTeamRankings BlogAboutTeamJobsContact
© 2005-2024 Team Rankings, LLC. All Rights Reserved. Statistical data provided by Gracenote.
TeamRankings.com is not affiliated with the National Collegiate Athletic Association (NCAA®) or March Madness Athletic Association, neither of which has supplied, reviewed, approved or endorsed the material on this site. TeamRankings.com is solely responsible for this site but makes no guarantee about the accuracy or completeness of the information herein.
Terms of ServicePrivacy Policy