Is There More Parity in College Basketball in 2020?
February 11, 2020 – by Jason Lisk
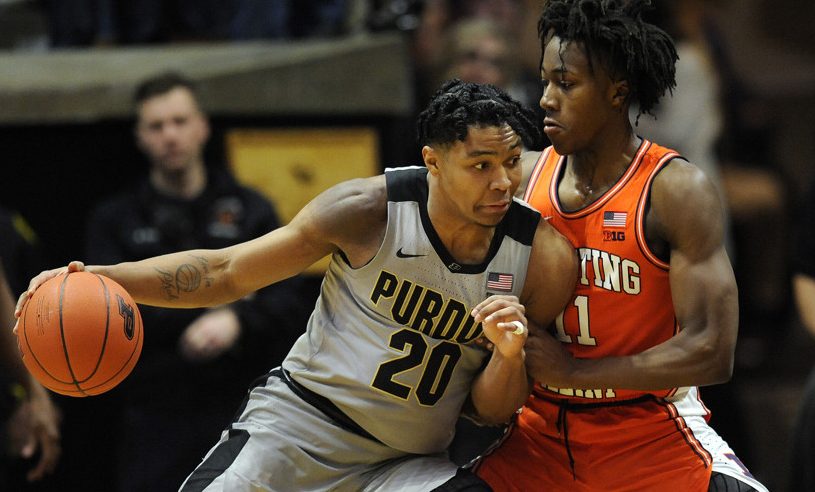
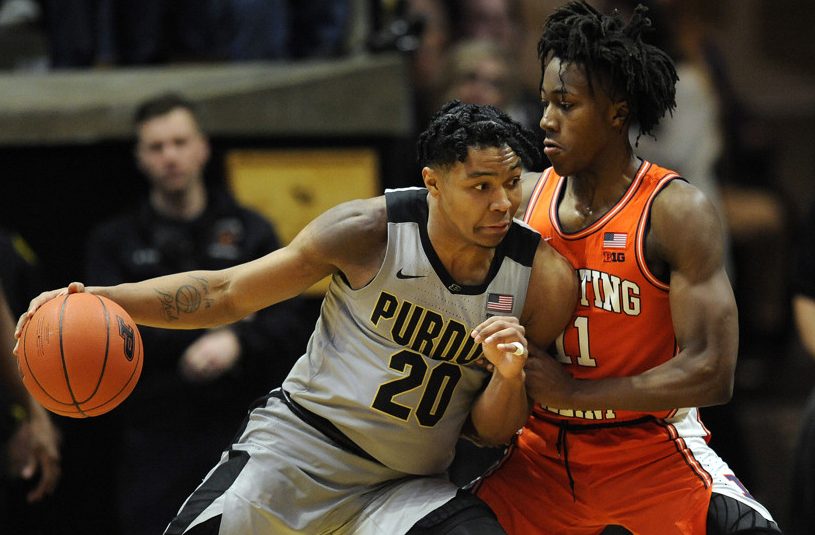
Purdue is power rated in the Top 15 but has lost double digit games already (Photo by Michael Allio/Icon Sportswire)
Is there more parity in College Basketball this season? The 2019-2020 College Basketball season has seen seven different teams reach No. 1 in the AP Poll. The only other time that has happened was back in 1983. That was the year NC State pulled off a miracle finish to win the national title over Houston. Early this year saw some shocking results, including Evansville beating Kentucky and Stephen F. Austin winning at Duke. Of course, two upsets don’t tell the whole story.
Overview on Parity in College Basketball
Below, we’ll present evidence for the following 2020 parity-related claims:
The top four teams look about as strong as top contenders from other recent seasons;The next tier of teams, though, is relatively weaker compared to other recent seasons, on the order of 1 to 1.5 points below comparably ranked teams;The “bubble”-type teams (ranked between 30 and 70 in our power ratings) are actually stronger than usual;Compared to 2019, the NCAA tournament seedings and predictive power ratings won’t match up as well. That may contribute to an appearance of parity, though it was last year that was the outlier in that respect.
Parity in College Basketball? Let’s Compare Ratings
Ken Pomeroy recently looked into the common refrain that this is a Season of Parity in College Basketball, by looking at changes in the AP Poll. He finds that “[a]t best, the claim of parity in college basketball this season is murky,” while also stating that “[t]his season seems to have above ~average~ parity, at least compared to the last decade or so.”
While Pomeroy looked at changes in the polls compared to the last decade, we are going to look at predictive power ratings and compare them to recent past seasons.
We’ll start by using our predictive power ratings for 2020 through Sunday, February 9. Those are the ratings exactly five weeks away from Selection Sunday. These power ratings are based on how teams relate to average within a given year.
Here is how the predictive power ratings for this season compare to the previous seven seasons, at the same “five week before Selection Sunday” date.
The tables compares the rating of, say, the fifth-ranked team this year (Baylor) to the fifth-ranked team in other seasons, in points above average. It also lists where this year’s team would fall compared to all others since 2013 who had the same ranking.
| Rank | School | Power Rating | Average Power Rating Last 7 Years | Rank (out of 8 Years) | Difference vs. Average |
|---|---|---|---|---|---|
| 1 | Kansas | 22.2 | 23.1 | 5 | -0.9 |
| 2 | Duke | 22.2 | 22.0 | 4 | +0.2 |
| 3 | Gonzaga | 21.5 | 20.9 | 3 | +0.6 |
| 4 | Michigan State | 20.0 | 20.3 | 5 | -0.3 |
| 5 | Baylor | 18.2 | 19.9 | 8 | -1.7 |
| 6 | Louisville | 17.9 | 19.4 | 8 | -1.5 |
| 7 | Arizona | 17.3 | 18.9 | 8 | -1.6 |
| 8 | Maryland | 17.2 | 18.4 | 8 | -1.2 |
| 9 | Ohio State | 16.9 | 18.2 | 8 | -1.3 |
| 10 | West Virginia | 16.8 | 17.9 | 8 | -1.1 |
| 11 | Dayton | 16.3 | 17.5 | 8 | -1.2 |
| 12 | San Diego State | 15.7 | 17.2 | 8 | -1.5 |
| 13 | Seton Hall | 15.6 | 16.8 | 8 | -1.2 |
| 14 | Florida State | 15.4 | 16.4 | 8 | -1.0 |
| 15 | Purdue | 15.3 | 16.0 | 7 | -0.7 |
| 16 | Kentucky | 15.2 | 15.6 | 6 | -0.4 |
| 17 | Penn State | 15.1 | 15.5 | 6 | -0.4 |
| 18 | Texas Tech | 14.7 | 15.1 | 5 | -0.4 |
| 19 | Butler | 14.6 | 14.7 | 4 | -0.1 |
| 20 | Oregon | 14.4 | 14.3 | 4 | +0.1 |
| 30 | Arkansas | 13.2 | 12.7 | 2 | +0.5 |
| 40 | VCU | 11.8 | 11.1 | 1 | +0.7 |
| 50 | Washington | 10.6 | 9.7 | 1 | +0.9 |
| 60 | Arizona State | 9.8 | 8.4 | 1 | +1.4 |
| 70 | South Carolina | 8.2 | 7.3 | 1 | +0.9 |
The Top Four Teams Look Like Typical “Best Teams in the Country”
The first thing that stands out about the above comparison is that the top four teams look fairly normal compared to other top four teams from past seasons. Some years have had an elite team or two that looked more dominant at this stage (2019 Duke with Zion, 2015 Kentucky). But others showed even less separation between the top team in the country and the next tier (2014 and 2016 stand out here).
So while there has been turnover at the top of the AP Rankings, the actual top tier of teams and leading contenders for a title resemble a fairly typical season.
The Next Tier of Teams Present the Case for Parity in College Basketball
While the top four teams look fairly typical, that breaks down with the next group of teams. Every team ranked between No. 5 and No. 14 is, relatively speaking, the lowest power-rated team at that particular ranking, compared to past seasons going back to 2013.
Take Baylor as an example. They have a rating of 18.2, fifth-best. That rating is 1.7 points below the average team ranked fifth at this point in the season. In fact, teams ranked at No. 9 at this point in the season have had an average rating of 18.2, the same as Baylor this year.
That effect largely goes away by the 20th spot, and we see that the teams there in the rankings again look fairly typical.
The Bubble Teams, Meanwhile, Are Stronger Than a Typical Year
If the teams in positions 5 through 14 in the rankings are rated lower than a typical team in those ranking spots, then other teams have to be higher. We see that effect in the chart when we look at the relative predictive power ratings for teams ranked 40th to 70th.
Those are the positions where a lot of the “bubble teams,” lower-seeded at-large selections, and top mid-major automatic bids reside. Every team ranked between 40 and 70 has a higher predictive power rating, compared to teams ranked in those spots in past seasons going back to 2013.
What does this mean? We still have more than a month to go until Selection Sunday to see how it shakes out. But right now, the differences between the No. 10 and No. 50 team are smaller than in past seasons, on the order of a 2-3 point margin.
To put that in win probability terms, in the average recent season, the No. 10 should beat the No. 50 team 77.5% of the time on a neutral court. This year, that expected win probability is 71.7% based on the relative rating differences between the teams.
The Top Teams and Top Seeds Will Not Line Up as Well in 2020 Compared to 2019
Last year, the top four teams in our predictive power ratings on Selection Sunday were the No. 1 seeds, and the next four teams in the ratings were the No. 2 seeds. That is rare. This year, it does not look like that will happen, based on the Committee’s early reveal and an understanding of how seeding decisions are made.
In fact, three of the top ten teams in our current power ratings were projected outside the top three seed lines by the committee: No. 4 Michigan State (4 seed), No. 7 Arizona (unseeded), and No. 9 Ohio State (unseeded).
It’s 2019, and not this year, though, that is the outlier. On average, three of the teams in our predictive rating Top Ten at this same point in the year ended up being seeded as a No. 4 seed or worse in past tournaments.
You also have teams like Texas Tech and Purdue also showing up in our Top 20 predictive ratings, and BYU just outside it at No. 21. Those teams are currently projected much lower in our latest bracketology. All three of them are currently projected on the 8/9 seed lines in the Bracket Matrix.
If teams with good predictive power ratings pull off “upsets” based on seed, it may re-inforce an idea that this year has more parity. The truth is the committee seeds based on past results, and not strictly future team strength. Because of differing schedule strengths, close game results, and luck, we may just see more good teams having worse seeds in 2020 as well.
Conclusion
From the perspective of likely tournament teams, the relative difference between most the top 20 teams and teams in the 30-70 range is smaller this year. That would support a belief that there is more parity in 2020. However, the top few teams in the predictive power rankings look to be just as strong as past top contenders for the national title. Six of the last seven national champs were in the top five in our predictive power ratings at this point in the season. This year, there is a larger gap between the top teams and the next tier of hopefuls compared to the average recent season.
If you liked this post, please share it. Thank you! Twitter Facebook
NFL Football Pool Picks NFL Survivor Pool Picks NCAA Bracket Picks College Bowl Pool Picks College Football Pool Picks NFL Picks NBA Picks MLB Picks College Football Picks College Basketball Picks NFL Predictions NBA Predictions MLB Predictions College Football Predictions College Basketball Predictions NFL Spread Picks NBA Spread Picks MLB Spread Picks College Football Spread Picks College Basketball Spread Picks NFL Rankings NBA Rankings MLB Rankings College Football Rankings College Basketball Rankings NFL Stats NBA Stats MLB Stats College Football Stats College Basketball Stats NFL Odds NBA Odds MLB Odds College Football Odds College Basketball Odds A product ofTeamRankings BlogAboutTeamJobsContact
© 2005-2024 Team Rankings, LLC. All Rights Reserved. Statistical data provided by Gracenote.
TeamRankings.com is not affiliated with the National Collegiate Athletic Association (NCAA®) or March Madness Athletic Association, neither of which has supplied, reviewed, approved or endorsed the material on this site. TeamRankings.com is solely responsible for this site but makes no guarantee about the accuracy or completeness of the information herein.
Terms of ServicePrivacy Policy