Preseason Bracketology: 2019 NCAA Tournament Bracket
November 6, 2018 – by David Hess
The NCAA basketball season tips off in just [checks notes] zero days, and we can’t wait to get started. To whet your appetite for the upcoming season, let’s check out some bracketology predictions.
Projected #1 Seeds
Here are our projected #1 seeds in the 2019 NCAA tournament:
Kansas (32% chance)Duke (32% chance)Gonzaga (31% chance)Virginia (26% chance)
Duke and Kansas at the top of both is to be expected. They are the #1 and #2 ranked teams in our preseason ratings. Kansas is ever so slightly ahead of Duke in the race for the overall #1, probably because of a better-designed non-conference schedule (with several marquee games and no truly bad teams) and an easier path to a conference regular season title.
Gonzaga on the third line is more surprising, as they are only #9 in our preseason ratings. Once you examine their schedule it makes more sense. They are expected to roll through the WCC, and are projected to enter the NCAA tournament with the fewest losses in the country, tied with Nevada. But while Nevada plays a nonconference schedule devoid of top ranked teams, the Zags have a couple chances to notch great wins (at UNC, vs. Tennessee).
Virginia as the fourth 1-seed over North Carolina is also a touch surprising. As we wrote about in our 2018-19 College Basketball Preseason Projected Standings post, UNC’s ACC schedule gives them a leg up over Virginia in the ACC title race because the two teams only play once, in Chapel Hill. It’s tough to say for sure since our model doesn’t produce reasons, only numbers, but what could be happening here is that the potential road win over UNC for Virginia is stronger than the potential home win over Virginia for UNC, and that’s giving them a slight edge.
Of course, we have more than just #1 seeds. On to the bracket!
Preseason Bracketology: 2019 Projected NCAA Tournament Bracket
(click to enlarge)
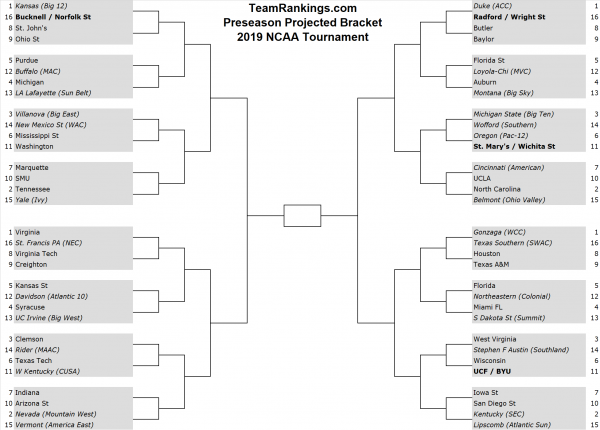
[Note: We’re not worried about following the NCAA’s bracketing rules here. We know that, for example, Florida shouldn’t potentially play Auburn in the second round. Our goal here is to show expected seed lines for each team, and give an idea of the rough quality of opponent they might face in each round. Trying to predict actual bracket matchups at this point is silly.]
[Note #2: Our original projections had incorrect postseason ban info, with some ineligible teams being forecast with non-zero tournament bid odds, and some eligible teams being forecast with 0% odds. We corrected the ban info, and re-ran the projections. For all teams, numbers in the table at the end of the post may have shifted slightly due to random variation in the simulations, and some teams have moved a line up or down in the above bracket.]
For details on how this bracket was created, see our original Madness Strikes November blog post. That post goes into more detail, but the basic idea is:
Simulate the regular seasonSeed & play out conference tournamentsSimulate NCAA tournament selection and seeding
Death To The RPI
For that last step above (simulate NCAA tournament selection and seeding), we use a model trained on historical NCAA Selection Committee decisions. Put another way, this model uses relevant historical data not to predict how the NCAA Selection Committee should select and seed teams, but rather to predict how it actually will select and seed teams. Sometimes the Committee emphasizes things that aren’t necessarily tied to team quality, and our model takes that into account.
However, the NCAA has announced a major change for the selection and seeding process this season — they are no longer using the RPI in the selection process. It has been replaced by something called the NET Rating, which is still a bit of a mystery.
We expect that this change will have an impact on the decisions made by the Selection Committee. However, we don’t know what that impact will be.
So for the time being, we are going to continue using our existing selection and seeding models, which feature RPI data as a prominent input. They likely won’t be as accurate this season, compared to past seasons. But we have no past NET Rating data to train a model on, and at this point the NCAA hasn’t released enough info for us to be able to mimic the NET Rating. As more info about the NET Rating becomes available, we hope to update and improve our models.
Preseason Bracketology 2019: Odds For All 353 Teams
Our selection & seeding model doesn’t directly produce the single bracket you see above. Its output is actually a set of odds describing each team’s chance to make the NCAA tournament, and to earn each specific seed (among other info). The bracket is created at the end, based on those odds.
What does that mean for you? It means you get to see lots of juicy data, if you so desire.
Here are our official 2019 NCAA Tournament preseason projected bracketology odds for every team. Bookmark this page for later, so you can come back and congratulate us on getting every single team correct. ?
For a sortable table of similar odds that we update daily, check out our NCAA Bracketology detail page.
And, even cooler, to see projected round by round NCAA Tournament advancement odds based on our simulated brackets, check out our NCAA Tournament Bracket Predictions.
| TR Bracket Seed | Team | Bid | Auto | At Large | Avg Seed If In | 1-4 Seed | 1 Seed |
|---|---|---|---|---|---|---|---|
| 1 | Duke | 93% | 23% | 70% | 3 | 74% | 33% |
| 1 | Kansas | 94% | 34% | 60% | 3.1 | 73% | 32% |
| 1 | Gonzaga | 93% | 59% | 35% | 3.7 | 64% | 30% |
| 1 | Virginia | 90% | 19% | 71% | 3.2 | 68% | 26% |
| 2 | Nevada | 96% | 53% | 43% | 3.6 | 69% | 21% |
| 2 | Kentucky | 87% | 25% | 62% | 3.7 | 60% | 22% |
| 2 | N Carolina | 93% | 20% | 73% | 3.6 | 64% | 22% |
| 2 | Tennessee | 81% | 21% | 60% | 3.9 | 53% | 19% |
| 3 | Villanova | 90% | 33% | 57% | 3.7 | 62% | 20% |
| 3 | Michigan St | 76% | 19% | 57% | 4.5 | 43% | 11% |
| 3 | W Virginia | 69% | 14% | 55% | 5 | 35% | 9% |
| 3 | Clemson | 68% | 7% | 61% | 5.1 | 33% | 8% |
| 4 | Syracuse | 71% | 7% | 64% | 5.1 | 35% | 8% |
| 4 | Miami (FL) | 66% | 6% | 59% | 5.1 | 32% | 7% |
| 4 | Auburn | 72% | 13% | 59% | 5.2 | 34% | 7% |
| 4 | Michigan | 60% | 13% | 47% | 5.2 | 28% | 6% |
| 5 | Purdue | 65% | 13% | 52% | 5.3 | 29% | 5% |
| 5 | Florida St | 69% | 7% | 63% | 5.4 | 31% | 6% |
| 5 | Florida | 66% | 12% | 54% | 5.4 | 30% | 6% |
| 5 | Kansas St | 61% | 12% | 49% | 5.4 | 27% | 5% |
| 6 | Texas Tech | 42% | 9% | 33% | 5.5 | 15% | 4% |
| 6 | Wisconsin | 56% | 12% | 44% | 5.6 | 22% | 3% |
| 6 | Oregon | 71% | 24% | 48% | 5.7 | 30% | 6% |
| 6 | Miss State | 59% | 9% | 50% | 5.8 | 24% | 5% |
| 7 | Marquette | 52% | 12% | 39% | 5.7 | 21% | 5% |
| 7 | Cincinnati | 73% | 23% | 49% | 5.9 | 29% | 6% |
| 7 | Iowa State | 41% | 8% | 33% | 5.9 | 14% | 3% |
| 7 | Indiana | 39% | 7% | 31% | 6.1 | 13% | 2% |
| 8 | VA Tech | 41% | 3% | 38% | 6.1 | 13% | 2% |
| 8 | Houston | 62% | 22% | 40% | 6 | 22% | 6% |
| 8 | Butler | 48% | 10% | 38% | 6.2 | 16% | 2% |
| 8 | St Johns | 41% | 10% | 31% | 6.5 | 12% | 2% |
| 9 | Ohio State | 40% | 6% | 34% | 6.4 | 13% | 2% |
| 9 | Baylor | 41% | 6% | 35% | 6.5 | 12% | 2% |
| 9 | Texas A&M | 40% | 5% | 35% | 6.5 | 13% | 2% |
| 9 | Creighton | 50% | 10% | 40% | 6.3 | 17% | 3% |
| 10 | Arizona St | 63% | 19% | 44% | 6.5 | 20% | 3% |
| 10 | San Diego St | 60% | 18% | 42% | 7.1 | 15% | 2% |
| 10 | UCLA | 54% | 14% | 40% | 6.8 | 16% | 3% |
| 10 | S Methodist | 44% | 13% | 31% | 7.3 | 10% | 1% |
| 11 | Washington | 44% | 11% | 33% | 7.6 | 10% | 1% |
| 11 | St Marys | 63% | 19% | 44% | 7.4 | 15% | 2% |
| 11 | Central FL | 43% | 10% | 33% | 8 | 7% | 1% |
| 11 | Wichita St | 41% | 11% | 30% | 8.3 | 6% | 1% |
| 11 | BYU | 48% | 15% | 33% | 8.6 | 6% | 1% |
| 11 | W Kentucky | 60% | 33% | 27% | 8.4 | 8% | 0% |
| 12 | Davidson | 53% | 20% | 33% | 8.7 | 7% | 0% |
| 12 | Northeastrn | 70% | 43% | 27% | 8.8 | 9% | 0% |
| 12 | Loyola-Chi | 47% | 23% | 24% | 9.1 | 5% | 0% |
| 12 | Buffalo | 65% | 37% | 28% | 9 | 7% | 0% |
| 13 | LA Lafayette | 48% | 33% | 16% | 10.5 | 2% | 0% |
| 13 | Montana | 63% | 50% | 13% | 10.6 | 2% | 0% |
| 13 | S Dakota St | 53% | 42% | 12% | 10.8 | 2% | 0% |
| 13 | UC Irvine | 45% | 36% | 9% | 11.3 | 1% | 0% |
| 14 | Rider | 41% | 30% | 11% | 11.7 | 1% | 0% |
| 14 | Ste F Austin | 60% | 57% | 3% | 12.4 | 0% | 0% |
| 14 | Wofford | 36% | 30% | 6% | 12.4 | 0% | 0% |
| 14 | N Mex State | 43% | 39% | 5% | 12.3 | 0% | 0% |
| 15 | Yale | 34% | 29% | 5% | 12.8 | 0% | 0% |
| 15 | Belmont | 36% | 30% | 6% | 12.9 | 0% | 0% |
| 15 | Lipscomb | 41% | 40% | 2% | 13.6 | 0% | 0% |
| 15 | Vermont | 45% | 43% | 2% | 13.9 | 0% | 0% |
| 16 | St Fran (PA) | 31% | 31% | 0% | 15.1 | 0% | 0% |
| 16 | TX Southern | 32% | 32% | 0% | 15.8 | 0% | 0% |
| 16 | Radford | 30% | 29% | 1% | 14.4 | 0% | 0% |
| 16 | Bucknell | 31% | 29% | 2% | 14.1 | 0% | 0% |
| 16 | Norfolk St | 27% | 27% | 0% | 15.8 | 0% | 0% |
| 16 | Wright State | 29% | 28% | 1% | 14.1 | 0% | 0% |
| Harvard | 48% | 28% | 20% | 10.7 | 1% | 0% | |
| Georgia St | 44% | 28% | 16% | 10.6 | 2% | 0% | |
| Illinois St | 42% | 22% | 20% | 9.6 | 3% | 0% | |
| Iowa | 38% | 8% | 30% | 5.8 | 13% | 3% | |
| Maryland | 37% | 6% | 31% | 6.4 | 11% | 2% | |
| U Penn | 37% | 26% | 11% | 11 | 1% | 0% | |
| Nebraska | 36% | 7% | 30% | 6.4 | 11% | 1% | |
| Texas | 36% | 6% | 31% | 6.5 | 11% | 2% | |
| TX Christian | 36% | 5% | 31% | 6.6 | 10% | 1% | |
| Xavier | 36% | 7% | 28% | 6.8 | 10% | 1% | |
| Oklahoma | 35% | 5% | 30% | 7.4 | 7% | 1% | |
| Alabama | 35% | 3% | 31% | 7.6 | 6% | 0% | |
| VCU | 35% | 11% | 24% | 9.7 | 3% | 0% | |
| Middle Tenn | 34% | 15% | 19% | 10.3 | 2% | 0% | |
| Valparaiso | 34% | 17% | 17% | 10.3 | 2% | 0% | |
| Richmond | 33% | 14% | 19% | 9.1 | 4% | 0% | |
| Temple | 33% | 8% | 25% | 8.9 | 3% | 0% | |
| NC-Grnsboro | 33% | 28% | 5% | 12.6 | 0% | 0% | |
| Fresno St | 32% | 8% | 24% | 8.7 | 4% | 0% | |
| South Dakota | 32% | 27% | 6% | 12.3 | 0% | 0% | |
| Arizona | 31% | 8% | 23% | 8.2 | 5% | 0% | |
| LSU | 30% | 3% | 27% | 7.4 | 6% | 1% | |
| Rhode Island | 30% | 10% | 20% | 10.1 | 2% | 0% | |
| Old Dominion | 30% | 16% | 14% | 10.2 | 1% | 0% | |
| Notre Dame | 29% | 2% | 27% | 6.5 | 8% | 1% | |
| USC | 29% | 8% | 21% | 8.2 | 5% | 0% | |
| Murray St | 29% | 25% | 4% | 13.2 | 0% | 0% | |
| Georgetown | 28% | 5% | 23% | 7.2 | 6% | 1% | |
| Providence | 28% | 5% | 23% | 7.3 | 6% | 1% | |
| New Mexico | 28% | 6% | 23% | 9.7 | 2% | 0% | |
| Grd Canyon | 28% | 26% | 2% | 13.4 | 0% | 0% | |
| NC State | 27% | 3% | 24% | 6.2 | 7% | 2% | |
| Louisville | 27% | 1% | 26% | 7.9 | 5% | 0% | |
| Seton Hall | 27% | 5% | 22% | 7.7 | 5% | 0% | |
| Dayton | 27% | 12% | 16% | 9.7 | 2% | 0% | |
| N Kentucky | 27% | 26% | 1% | 14.1 | 0% | 0% | |
| St Bonavent | 26% | 9% | 17% | 10.5 | 1% | 0% | |
| Iona | 26% | 20% | 6% | 12.5 | 0% | 0% | |
| Winthrop | 26% | 25% | 1% | 14.6 | 0% | 0% | |
| Penn State | 25% | 3% | 22% | 7.5 | 5% | 0% | |
| Furman | 25% | 20% | 5% | 13 | 0% | 0% | |
| Fla Gulf Cst | 24% | 24% | 0% | 14.6 | 0% | 0% | |
| Boise State | 23% | 5% | 17% | 9.9 | 1% | 0% | |
| Toledo | 23% | 14% | 9% | 11.3 | 1% | 0% | |
| Utah Val St | 23% | 20% | 3% | 13.6 | 0% | 0% | |
| S Carolina | 22% | 2% | 20% | 8 | 3% | 0% | |
| N Iowa | 22% | 10% | 12% | 11.1 | 1% | 0% | |
| Oregon St | 21% | 5% | 16% | 9 | 2% | 0% | |
| Saint Louis | 21% | 9% | 12% | 10.3 | 1% | 0% | |
| Ball State | 21% | 13% | 9% | 11.8 | 0% | 0% | |
| Wm & Mary | 21% | 12% | 9% | 12.2 | 0% | 0% | |
| NC Central | 20% | 20% | 0% | 15.9 | 0% | 0% | |
| UC Davis | 20% | 17% | 2% | 13.1 | 0% | 0% | |
| Canisius | 19% | 15% | 4% | 13.2 | 0% | 0% | |
| CS Fullerton | 19% | 15% | 4% | 13.1 | 0% | 0% | |
| E Michigan | 19% | 10% | 9% | 12.1 | 0% | 0% | |
| Lehigh | 19% | 18% | 1% | 14.7 | 0% | 0% | |
| Marshall | 19% | 10% | 9% | 11.2 | 0% | 0% | |
| Connecticut | 18% | 5% | 13% | 9.1 | 2% | 0% | |
| Colorado | 18% | 4% | 14% | 9.2 | 1% | 0% | |
| Stony Brook | 18% | 17% | 0% | 14.9 | 0% | 0% | |
| Wagner | 18% | 18% | 0% | 15.5 | 0% | 0% | |
| Georgia | 17% | 2% | 15% | 7.7 | 3% | 0% | |
| Northwestern | 17% | 3% | 14% | 7 | 3% | 0% | |
| Utah | 17% | 5% | 12% | 9.1 | 1% | 0% | |
| Grambling St | 17% | 17% | 0% | 15.9 | 0% | 0% | |
| Hofstra | 17% | 11% | 6% | 12.2 | 0% | 0% | |
| Howard | 17% | 17% | 0% | 15.9 | 0% | 0% | |
| S Illinois | 17% | 9% | 8% | 11.5 | 0% | 0% | |
| Col Charlestn | 16% | 12% | 4% | 12.5 | 0% | 0% | |
| Liberty | 16% | 16% | 0% | 14.7 | 0% | 0% | |
| Monmouth | 16% | 13% | 4% | 13.5 | 0% | 0% | |
| Rob Morris | 16% | 16% | 0% | 15.5 | 0% | 0% | |
| S Alabama | 16% | 13% | 3% | 12.5 | 0% | 0% | |
| Jksnville St | 15% | 14% | 1% | 14.4 | 0% | 0% | |
| LA Tech | 15% | 7% | 7% | 11.6 | 0% | 0% | |
| Prairie View | 15% | 15% | 0% | 16 | 0% | 0% | |
| Weber State | 15% | 14% | 1% | 13.8 | 0% | 0% | |
| Missouri | 14% | 2% | 12% | 7.6 | 2% | 0% | |
| E Tenn St | 14% | 13% | 1% | 13.9 | 0% | 0% | |
| Princeton | 14% | 10% | 5% | 12.8 | 0% | 0% | |
| St Josephs | 14% | 4% | 9% | 11.5 | 0% | 0% | |
| UCSB | 14% | 13% | 1% | 13.5 | 0% | 0% | |
| Beth-Cook | 13% | 13% | 0% | 15.9 | 0% | 0% | |
| E Washingtn | 13% | 11% | 2% | 14.1 | 0% | 0% | |
| Hartford | 13% | 13% | 0% | 15.1 | 0% | 0% | |
| IPFW | 13% | 11% | 2% | 13.6 | 0% | 0% | |
| LIU-Brooklyn | 13% | 13% | 0% | 15.6 | 0% | 0% | |
| UNLV | 13% | 7% | 6% | 11.2 | 0% | 0% | |
| Vanderbilt | 12% | 1% | 11% | 8.3 | 2% | 0% | |
| Memphis | 12% | 3% | 9% | 10 | 1% | 0% | |
| Army | 12% | 12% | 0% | 15 | 0% | 0% | |
| San Diego | 12% | 3% | 9% | 11.2 | 0% | 0% | |
| Tulsa | 11% | 3% | 8% | 9.9 | 1% | 0% | |
| Austin Peay | 11% | 10% | 1% | 14.6 | 0% | 0% | |
| Colgate | 11% | 11% | 0% | 15.1 | 0% | 0% | |
| Geo Mason | 11% | 4% | 7% | 11.2 | 0% | 0% | |
| IL-Chicago | 11% | 11% | 0% | 15 | 0% | 0% | |
| NC-Wilmgton | 11% | 7% | 4% | 12.8 | 0% | 0% | |
| Arkansas | 10% | 1% | 9% | 8.6 | 1% | 0% | |
| Albany | 10% | 10% | 0% | 15.3 | 0% | 0% | |
| GA Southern | 10% | 7% | 3% | 12.9 | 0% | 0% | |
| High Point | 10% | 10% | 0% | 15.3 | 0% | 0% | |
| Kent State | 10% | 7% | 3% | 12.7 | 0% | 0% | |
| N Colorado | 10% | 9% | 1% | 14.2 | 0% | 0% | |
| N Dakota St | 10% | 8% | 2% | 14 | 0% | 0% | |
| Southern | 10% | 10% | 0% | 16 | 0% | 0% | |
| Boston Col | 9% | 0% | 9% | 8.4 | 1% | 0% | |
| Oklahoma St | 9% | 1% | 8% | 8.8 | 1% | 0% | |
| Alabama St | 9% | 9% | 0% | 16 | 0% | 0% | |
| Bradley | 9% | 5% | 3% | 12.1 | 0% | 0% | |
| F Dickinson | 9% | 9% | 0% | 15.7 | 0% | 0% | |
| Holy Cross | 9% | 8% | 0% | 15.2 | 0% | 0% | |
| Lamar | 9% | 9% | 0% | 15 | 0% | 0% | |
| Maryland BC | 9% | 9% | 0% | 15.3 | 0% | 0% | |
| Nicholls St | 9% | 8% | 0% | 15.2 | 0% | 0% | |
| NJIT | 9% | 9% | 0% | 15.2 | 0% | 0% | |
| Oakland | 9% | 8% | 0% | 15.3 | 0% | 0% | |
| UAB | 9% | 6% | 3% | 11.8 | 0% | 0% | |
| Minnesota | 8% | 1% | 7% | 7.8 | 1% | 0% | |
| Campbell | 8% | 8% | 0% | 15.4 | 0% | 0% | |
| CS Bakersfld | 8% | 8% | 1% | 14.7 | 0% | 0% | |
| Hampton | 8% | 8% | 0% | 15.4 | 0% | 0% | |
| Hawaii | 8% | 7% | 0% | 14.3 | 0% | 0% | |
| Lg Beach St | 8% | 8% | 1% | 14.3 | 0% | 0% | |
| Morehead St | 8% | 7% | 1% | 14.6 | 0% | 0% | |
| N Florida | 8% | 8% | 0% | 15.1 | 0% | 0% | |
| Ohio | 8% | 5% | 3% | 13 | 0% | 0% | |
| St Peters | 8% | 8% | 1% | 14.3 | 0% | 0% | |
| Stanford | 8% | 2% | 6% | 10.4 | 0% | 0% | |
| WI-Grn Bay | 8% | 8% | 0% | 15.3 | 0% | 0% | |
| DePaul | 7% | 2% | 5% | 8.2 | 1% | 0% | |
| Illinois | 7% | 1% | 6% | 8.5 | 1% | 0% | |
| App State | 7% | 5% | 2% | 13.3 | 0% | 0% | |
| Boston U | 7% | 7% | 0% | 15.3 | 0% | 0% | |
| Gard-Webb | 7% | 7% | 0% | 15.6 | 0% | 0% | |
| Indiana St | 7% | 4% | 3% | 12.5 | 0% | 0% | |
| IUPUI | 7% | 7% | 0% | 15.4 | 0% | 0% | |
| Jackson St | 7% | 7% | 0% | 16 | 0% | 0% | |
| Missouri St | 7% | 5% | 3% | 12.5 | 0% | 0% | |
| North Texas | 7% | 5% | 2% | 12.3 | 0% | 0% | |
| San Fransco | 7% | 2% | 5% | 11.1 | 0% | 0% | |
| Ark Pine Bl | 6% | 6% | 0% | 16 | 0% | 0% | |
| Charl South | 6% | 6% | 0% | 15.5 | 0% | 0% | |
| Evansville | 6% | 3% | 2% | 12.8 | 0% | 0% | |
| James Mad | 6% | 5% | 1% | 13.5 | 0% | 0% | |
| Mississippi | 6% | 1% | 6% | 9.1 | 0% | 0% | |
| Morgan St | 6% | 6% | 0% | 16 | 0% | 0% | |
| NC-Asheville | 6% | 6% | 0% | 15.6 | 0% | 0% | |
| Sam Hous St | 6% | 5% | 0% | 15.3 | 0% | 0% | |
| Towson | 6% | 4% | 2% | 13.6 | 0% | 0% | |
| WI-Milwkee | 6% | 6% | 0% | 15.5 | 0% | 0% | |
| Akron | 5% | 4% | 1% | 13.6 | 0% | 0% | |
| Central Mich | 5% | 4% | 1% | 13.5 | 0% | 0% | |
| Delaware | 5% | 3% | 1% | 13.9 | 0% | 0% | |
| Denver | 5% | 5% | 0% | 14.9 | 0% | 0% | |
| Navy | 5% | 5% | 0% | 15.4 | 0% | 0% | |
| Siena | 5% | 5% | 0% | 15.5 | 0% | 0% | |
| U Mass | 5% | 2% | 3% | 11.9 | 0% | 0% | |
| Utah State | 5% | 1% | 4% | 11.9 | 0% | 0% | |
| Abl Christian | 4% | 4% | 0% | 15.4 | 0% | 0% | |
| American | 4% | 4% | 0% | 15.5 | 0% | 0% | |
| Brown | 4% | 3% | 1% | 14 | 0% | 0% | |
| Cleveland St | 4% | 4% | 0% | 15.6 | 0% | 0% | |
| Geo Wshgtn | 4% | 2% | 3% | 12.3 | 0% | 0% | |
| Idaho State | 4% | 3% | 0% | 15.1 | 0% | 0% | |
| LA Monroe | 4% | 4% | 1% | 14 | 0% | 0% | |
| Maryland ES | 4% | 4% | 0% | 16 | 0% | 0% | |
| Mercer | 4% | 4% | 0% | 15.1 | 0% | 0% | |
| N Illinois | 4% | 3% | 1% | 13.8 | 0% | 0% | |
| Portland St | 4% | 4% | 0% | 14.9 | 0% | 0% | |
| S Mississippi | 4% | 2% | 2% | 13.2 | 0% | 0% | |
| SE Louisiana | 4% | 4% | 0% | 15.5 | 0% | 0% | |
| Seattle | 4% | 4% | 0% | 15.3 | 0% | 0% | |
| TN State | 4% | 4% | 0% | 15.1 | 0% | 0% | |
| Troy | 4% | 4% | 1% | 13.7 | 0% | 0% | |
| Wake Forest | 4% | 0% | 4% | 9.3 | 0% | 0% | |
| Binghamton | 3% | 3% | 0% | 15.7 | 0% | 0% | |
| Bowling Grn | 3% | 2% | 1% | 14.1 | 0% | 0% | |
| Central Conn | 3% | 3% | 0% | 15.9 | 0% | 0% | |
| Columbia | 3% | 3% | 0% | 14.3 | 0% | 0% | |
| Drake | 3% | 2% | 1% | 13.2 | 0% | 0% | |
| Elon | 3% | 3% | 1% | 14.2 | 0% | 0% | |
| Fairfield | 3% | 3% | 0% | 15.1 | 0% | 0% | |
| Idaho | 3% | 3% | 0% | 15.3 | 0% | 0% | |
| Jacksonville | 3% | 3% | 0% | 15.6 | 0% | 0% | |
| La Salle | 3% | 1% | 2% | 12.6 | 0% | 0% | |
| Lafayette | 3% | 3% | 0% | 15.5 | 0% | 0% | |
| Loyola Mymt | 3% | 1% | 2% | 12.3 | 0% | 0% | |
| McNeese St | 3% | 3% | 0% | 15.6 | 0% | 0% | |
| Miami (OH) | 3% | 2% | 1% | 13.6 | 0% | 0% | |
| N Hampshire | 3% | 3% | 0% | 15.7 | 0% | 0% | |
| NC A&T | 3% | 3% | 0% | 16 | 0% | 0% | |
| Neb Omaha | 3% | 3% | 0% | 15.2 | 0% | 0% | |
| New Orleans | 3% | 3% | 0% | 15.5 | 0% | 0% | |
| Niagara | 3% | 2% | 0% | 15.1 | 0% | 0% | |
| Pacific | 3% | 1% | 2% | 12.4 | 0% | 0% | |
| S Car State | 3% | 3% | 0% | 16 | 0% | 0% | |
| Sacred Hrt | 3% | 3% | 0% | 15.9 | 0% | 0% | |
| St Fran (NY) | 3% | 3% | 0% | 15.9 | 0% | 0% | |
| Texas State | 3% | 2% | 0% | 14.5 | 0% | 0% | |
| TN Martin | 3% | 3% | 0% | 15.1 | 0% | 0% | |
| TX A&M-CC | 3% | 3% | 0% | 15.6 | 0% | 0% | |
| TX El Paso | 3% | 2% | 1% | 13 | 0% | 0% | |
| TX-San Ant | 3% | 2% | 1% | 13.2 | 0% | 0% | |
| UMKC | 3% | 3% | 0% | 15.5 | 0% | 0% | |
| Alcorn State | 2% | 2% | 0% | 16 | 0% | 0% | |
| Bryant | 2% | 2% | 0% | 15.9 | 0% | 0% | |
| Cal Poly | 2% | 2% | 0% | 15.4 | 0% | 0% | |
| California | 2% | 1% | 1% | 11.3 | 0% | 0% | |
| Central Ark | 2% | 2% | 0% | 15.6 | 0% | 0% | |
| Coastal Car | 2% | 1% | 0% | 14.4 | 0% | 0% | |
| Coppin State | 2% | 2% | 0% | 16 | 0% | 0% | |
| Duquesne | 2% | 1% | 1% | 12.3 | 0% | 0% | |
| E Kentucky | 2% | 2% | 0% | 15.2 | 0% | 0% | |
| Florida Intl | 2% | 1% | 1% | 13.5 | 0% | 0% | |
| Loyola-MD | 2% | 2% | 0% | 15.8 | 0% | 0% | |
| Mass Lowell | 2% | 2% | 0% | 15.8 | 0% | 0% | |
| Miss Val St | 2% | 2% | 0% | 16 | 0% | 0% | |
| Montana St | 2% | 2% | 0% | 15.5 | 0% | 0% | |
| North Dakota | 2% | 2% | 0% | 15.4 | 0% | 0% | |
| Oral Roberts | 2% | 2% | 0% | 15.4 | 0% | 0% | |
| Quinnipiac | 2% | 2% | 0% | 15.2 | 0% | 0% | |
| Sac State | 2% | 2% | 0% | 15.4 | 0% | 0% | |
| Savannah St | 2% | 2% | 0% | 16 | 0% | 0% | |
| TN Tech | 2% | 2% | 0% | 15.3 | 0% | 0% | |
| TX-Arlington | 2% | 2% | 0% | 14.5 | 0% | 0% | |
| UC Riverside | 2% | 2% | 0% | 15.4 | 0% | 0% | |
| W Michigan | 2% | 2% | 0% | 14.5 | 0% | 0% | |
| Wyoming | 2% | 1% | 1% | 12.4 | 0% | 0% | |
| AR Lit Rock | 1% | 1% | 0% | 14.8 | 0% | 0% | |
| Arkansas St | 1% | 0% | 0% | 14.8 | 0% | 0% | |
| Chattanooga | 1% | 1% | 0% | 15.7 | 0% | 0% | |
| Citadel | 1% | 1% | 0% | 15.6 | 0% | 0% | |
| Colorado St | 1% | 0% | 1% | 12.2 | 0% | 0% | |
| Cornell | 1% | 1% | 0% | 14.7 | 0% | 0% | |
| Dartmouth | 1% | 1% | 0% | 15 | 0% | 0% | |
| Delaware St | 1% | 1% | 0% | 16 | 0% | 0% | |
| Detroit | 1% | 1% | 0% | 15.9 | 0% | 0% | |
| E Illinois | 1% | 1% | 0% | 15.7 | 0% | 0% | |
| Florida A&M | 1% | 1% | 0% | 16 | 0% | 0% | |
| GA Tech | 1% | 0% | 1% | 9.4 | 0% | 0% | |
| Houston Bap | 1% | 1% | 0% | 15.8 | 0% | 0% | |
| Kennesaw St | 1% | 1% | 0% | 15.9 | 0% | 0% | |
| Maine | 1% | 1% | 0% | 15.9 | 0% | 0% | |
| Manhattan | 1% | 1% | 0% | 15.6 | 0% | 0% | |
| Marist | 1% | 1% | 0% | 15.4 | 0% | 0% | |
| Mt St Marys | 1% | 1% | 0% | 15.9 | 0% | 0% | |
| Pittsburgh | 1% | 0% | 1% | 9.6 | 0% | 0% | |
| Presbyterian | 1% | 1% | 0% | 15.9 | 0% | 0% | |
| Rutgers | 1% | 0% | 1% | 9.7 | 0% | 0% | |
| S Utah | 1% | 1% | 0% | 15.7 | 0% | 0% | |
| Samford | 1% | 1% | 0% | 15.7 | 0% | 0% | |
| SC Upstate | 1% | 1% | 0% | 16 | 0% | 0% | |
| SE Missouri | 1% | 1% | 0% | 15.3 | 0% | 0% | |
| SIU Edward | 1% | 1% | 0% | 15.6 | 0% | 0% | |
| Tulane | 1% | 0% | 1% | 12.2 | 0% | 0% | |
| TX-Pan Am | 1% | 1% | 0% | 15.8 | 0% | 0% | |
| VA Military | 1% | 1% | 0% | 15.8 | 0% | 0% | |
| W Carolina | 1% | 1% | 0% | 15.7 | 0% | 0% | |
| W Illinois | 1% | 1% | 0% | 15.7 | 0% | 0% | |
| Youngs St | 1% | 1% | 0% | 15.8 | 0% | 0% | |
| Air Force | 0% | 0% | 0% | 13.6 | 0% | 0% | |
| Alab A&M | 0% | 0% | 0% | 0 | 0% | 0% | |
| Cal St Nrdge | 0% | 0% | 0% | 16 | 0% | 0% | |
| California Baptist | 0% | 0% | 0% | 0 | 0% | 0% | |
| Charlotte | 0% | 0% | 0% | 14.7 | 0% | 0% | |
| Chicago St | 0% | 0% | 0% | 16 | 0% | 0% | |
| Drexel | 0% | 0% | 0% | 15.4 | 0% | 0% | |
| E Carolina | 0% | 0% | 0% | 11.6 | 0% | 0% | |
| Fla Atlantic | 0% | 0% | 0% | 14.2 | 0% | 0% | |
| Fordham | 0% | 0% | 0% | 13.5 | 0% | 0% | |
| Incar Word | 0% | 0% | 0% | 15.9 | 0% | 0% | |
| Longwood | 0% | 0% | 0% | 16 | 0% | 0% | |
| N Arizona | 0% | 0% | 0% | 15.9 | 0% | 0% | |
| North Alabama | 0% | 0% | 0% | 0 | 0% | 0% | |
| NW State | 0% | 0% | 0% | 15.9 | 0% | 0% | |
| Pepperdine | 0% | 0% | 0% | 13.8 | 0% | 0% | |
| Portland | 0% | 0% | 0% | 14.5 | 0% | 0% | |
| Rice | 0% | 0% | 0% | 15.2 | 0% | 0% | |
| S Florida | 0% | 0% | 0% | 12.9 | 0% | 0% | |
| San Jose St | 0% | 0% | 0% | 15.6 | 0% | 0% | |
| Santa Clara | 0% | 0% | 0% | 13.7 | 0% | 0% | |
| Stetson | 0% | 0% | 0% | 15.9 | 0% | 0% | |
| Wash State | 0% | 0% | 0% | 11.9 | 0% | 0% |
Finally, here’s a quick reminder. If you haven’t checked out the rest of our projections, please do! They include:
College Basketball Projected Conference Standings. Projected conference records and full regular season records, plus win odds for both the conference regular season title and the postseason tournament.Bracketology Projections. Odds to make the NCAA tournament, plus projected seeding, and lots more details. (One of our faves is the Bracketology By Conference page.)NCAA Tournament Bracket Predictions. Round by round advancement odds, including probability of a team making the Sweet 16, making the Final Four, or winning the championship.
If you liked this post, please share it. Thank you! Twitter Facebook
NFL Football Pool Picks NFL Survivor Pool Picks NCAA Bracket Picks College Bowl Pool Picks College Football Pool Picks NFL Picks NBA Picks MLB Picks College Football Picks College Basketball Picks NFL Predictions NBA Predictions MLB Predictions College Football Predictions College Basketball Predictions NFL Spread Picks NBA Spread Picks MLB Spread Picks College Football Spread Picks College Basketball Spread Picks NFL Rankings NBA Rankings MLB Rankings College Football Rankings College Basketball Rankings NFL Stats NBA Stats MLB Stats College Football Stats College Basketball Stats NFL Odds NBA Odds MLB Odds College Football Odds College Basketball Odds A product ofTeamRankings BlogAboutTeamJobsContact
© 2005-2024 Team Rankings, LLC. All Rights Reserved. Statistical data provided by Gracenote.
TeamRankings.com is not affiliated with the National Collegiate Athletic Association (NCAA®) or March Madness Athletic Association, neither of which has supplied, reviewed, approved or endorsed the material on this site. TeamRankings.com is solely responsible for this site but makes no guarantee about the accuracy or completeness of the information herein.
Terms of ServicePrivacy Policy